Reservoirs full 47% End of the 2026 water year, down from 60%.
Oil produced in 2025 67.9 million Barrels, a record; 93% from the Uinta Basin.
Acres burned in 2026 560,000+ In more than 1,200 wildfires.
Source: KSL; Gardner Policy Institute and Utah Geological Survey; Fox 13.
About Who regulates energy, water and the environment Legislative Executive Judicial Environmental Quality Air, drinking water, water quality and waste permits. Source Natural Resources Water rights, oil and gas wells, and the Great Salt Lake. Source Public Service Commission Sets rates for power, gas and phone utilities. Source Why it matters Numbers worth knowing Low reservoirs Utah enters the new water year with reservoirs under half full. Source Record oil Crude production reached a record 67.9 million barrels in 2025. Source Costly fires Firefighting in 2026 cost $253 million across all agencies. Source
Power, water and air
1
Utah Guide
Find which permits you need
The DEQ Permit Guide walks through air, water, waste and cleanup permits a project may need.
Go to the source →
2
Utah Before you drill
You need a water right
In Utah you must own a water right to divert and use water. Licensed well drillers cannot drill until the State Engineer gives permission.
Go to the source →
3
Utah Utilities
File a utility complaint
Call your utility first; if that fails, file an informal complaint with the Division of Public Utilities, (801) 530-7622.
Go to the source →
November 2026 S M T W T F S 1 2 3 4 5 6 7 8 9 10 11 12 13 14 15 16 17 18 19 20 21 22 23 24 25 26 27 28 29 30
Dec. 1 Dust rule comments due Last day to comment on two proposed changes to fugitive dust rules. Environmental Quality Jan. 19 Legislature opens The 2027 session runs to March 5; water, energy and air bills are heard there. Utah Legislature More events →
Households and Residents Water supply, heating bills, clean air and safe water
News for households Drought, heating costs and the outdoors Water · KSL · Oct. 6 Utah's “truly strange” 2026 water year has ended. What happens next? Reservoirs fell from 60% full to 47% over the water year after a record-low snowpack, and more than 85% of Utah is in severe or extreme drought. What the state data shows
Reservoirs went from 60% full to 47% over the water year. The Great Salt Lake's south arm is 1.2 feet lower than a year ago, at 4,190.0 feet.
Oct. 1, 2025: 60% 60% Oct. 1, 2025 Sept. 30, 2026: 47% 47% Sept. 30, 2026 4,189.1 ft 4,190.3 ft 4,191.6 ft 4,192.8 ft 4,194.0 ft Jan 2025 Jul Jan 2026 Jul Nov. 15, 2025: 4,191.2 ft 4,191.2 ft Nov. 15, 2026: 4,190.0 ft 4,190.0 ft Source: KSL (reservoirs); USGS Saltair gauge (lake) What you can do: Water rights Utah home natural gas prices
Aug. 2026: $12.78 per 1,000 cubic feet, +5.9% from a year earlier. Prices shown are what homes paid in each month.
$9 $10 $11 $12 $13 Jan 2025: $10.00 Feb 2025: $9.50 Mar 2025: $9.66 Apr 2025: $9.63 May 2025: $10.14 Jun 2025: $11.17 Jul 2025: $11.89 Aug 2025: $12.07 Jan 2026: $11.28 Feb 2026: $10.59 Mar 2026: $11.32 Apr 2026: $11.54 May 2026: $10.26 Jun 2026: $11.84 Jul 2026: $12.38 Aug 2026: $12.78 Jan Feb Mar Apr May Jun Jul Aug
Source: EIA More Utah news → At a glance Up to $150 Nov. 1–March 1 · Environmental Quality On mandatory action days, wood and pellet stoves can't be used; gas and propane are fine.
Read more → Open to all Since Nov. 1 · Workforce Services HEAT helps pay power and gas bills for households under its income limits.
Read more → Nov. 15–March 15 Workforce Services Behind on a bill? Apply through HEAT and keep up a payment plan to avoid a winter shut-off.
Read more → 1 in 3 homes Environmental Quality Test above the level to fix; a state kit costs about $11, and most fixes cost $1,500 or less.
Read more → Look it up Division of Drinking Water Check your address on the state lead service line map, or ask your water system.
Read more → Up to $3 a sq. ft. Water Resources Rebates for replacing grass in cities with water-efficiency standards.
Read more → 5 business days Division of Public Utilities Staff usually work out an informal complaint with the utility within 5 business days.
Read more → 500+ incentives Environmental Quality Vehicle repair, e-bike, solar and EV charger programs in one finder.
Read more →
Energy and Water Businesses Utilities, developers, drillers and companies that need permits
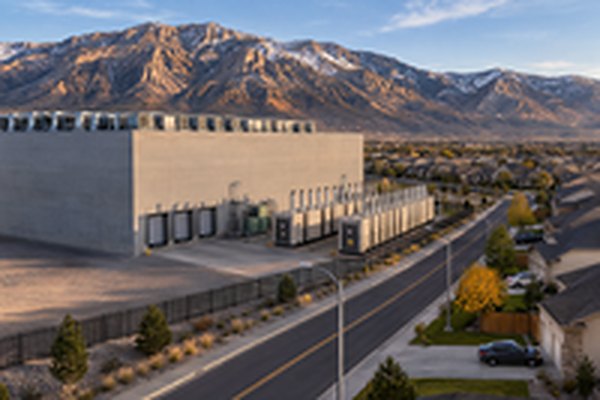
News for energy and water businesses Power demand, rates and production Data centers · Salt Lake Tribune · Sept. 9 A Millard County campus promises the “largest data center campus in the world” The county approved zoning and a permit for the 1,143-acre campus near Delta, natural gas work is underway, and the company says it could recover more water than it uses. Where Utah's power came from
Jan. to Aug., 2025 vs. 2026: natural gas +52%, coal -31%, solar +21%. Thousand megawatt-hours.
Natural gas Natural gas, 2025: 7,113 7,113 Natural gas, 2026: 10,789 10,789 Coal Coal, 2025: 12,251 12,251 Coal, 2026: 8,447 8,447 Solar Solar, 2025: 4,617 4,617 Solar, 2026: 5,576 5,576
Source: EIA Electric Power Monthly What you can do: Oil, gas and energy What homes pay for electricity
Average residential price, Aug. 2026 vs. a year earlier, in cents per kilowatt-hour. Utah homes pay about 27% less than the U.S. average.
Utah Utah, Aug. 2025: 13.62¢ 13.62¢ Utah, Aug. 2026: 13.31¢ 13.31¢ U.S. average U.S. average, Aug. 2025: 17.57¢ 17.57¢ U.S. average, Aug. 2026: 18.16¢ 18.16¢
Source: EIA table 5.6.A Utah crude oil production
Millions of barrels. 2026 through Aug. is +2.1% ahead of the same months of 2025.
2024: 65.2M 65.2M 2024 2025: 67.9M 67.9M 2025 2025, Jan.–Aug: 45.8M 45.8M 2025, Jan.–Aug 2026, Jan.–Aug: 46.8M 46.8M 2026, Jan.–Aug Source: EIA More business news → At a glance One guide Environmental Quality The DEQ Permit Guide walks through air, water, waste and cleanup permits a project may need.
Read more → Free help Environmental Quality Businesses with fewer than 100 employees get free, confidential help with environmental rules.
Read more → Before you drill Division of Water Rights You must own a water right to divert and use water; drillers wait for the State Engineer.
Read more → 7 years Division of Water Rights An unused right can be forfeited; file an Application for Nonuse to protect it.
Read more → 1 year Oil, Gas and Mining File Form 3 electronically and post a bond first; new bonding rules took effect July 8, 2026.
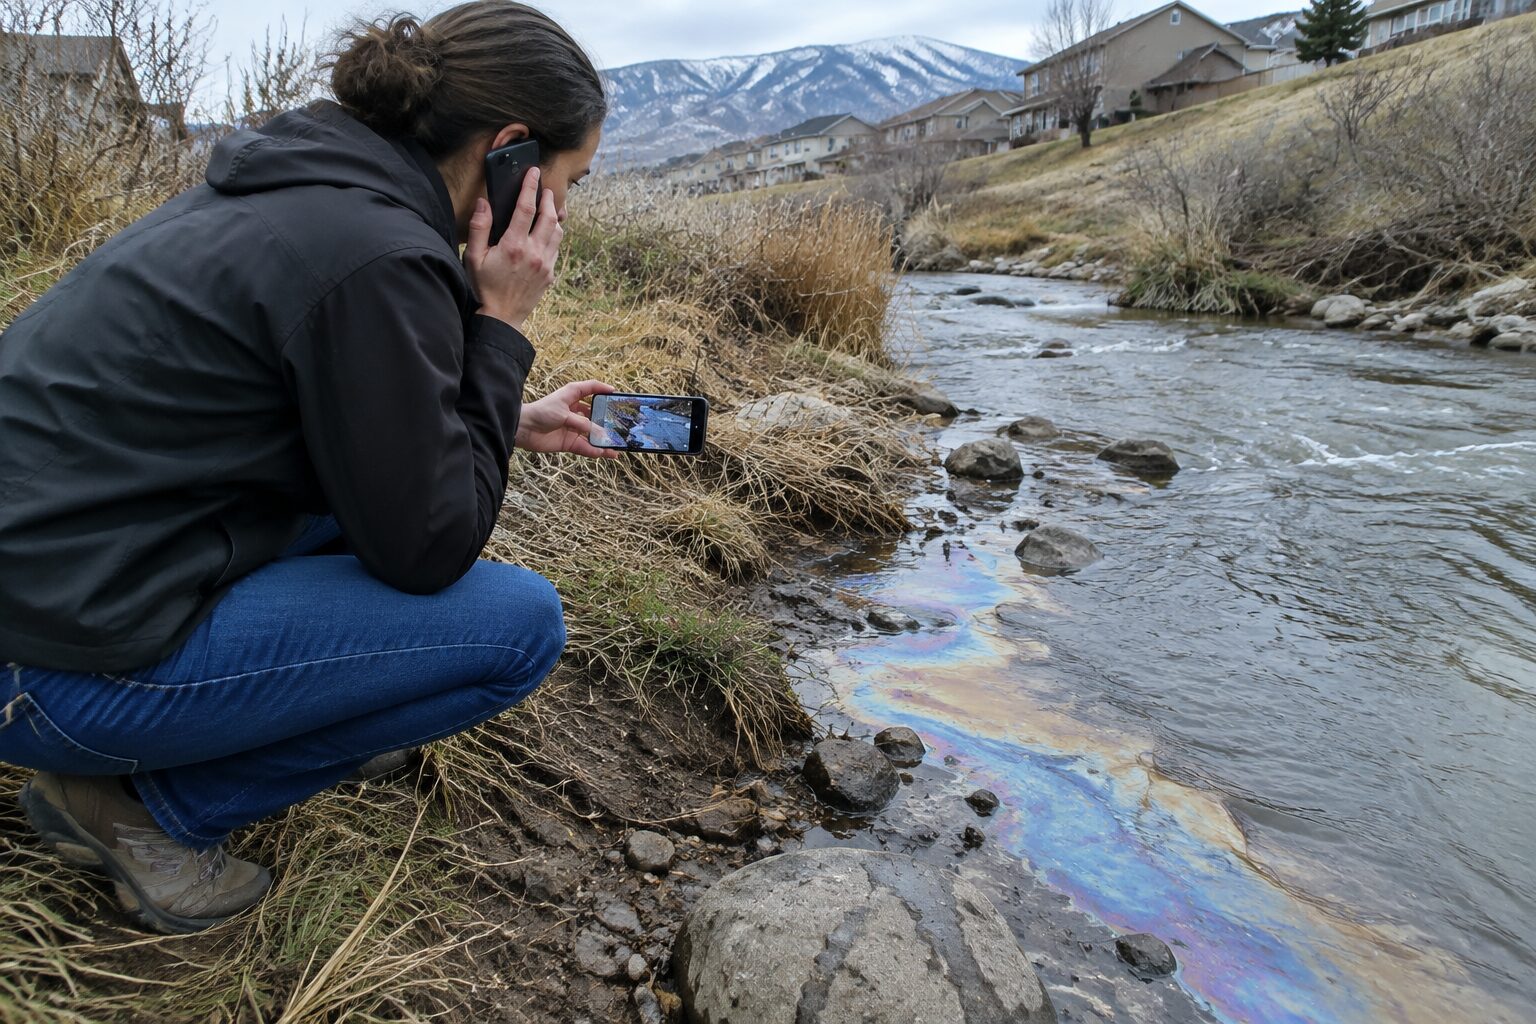
Read more → 24 hours Environmental Quality Report major environmental incidents any time at (801) 536-4123; call 911 first if lives are at risk.
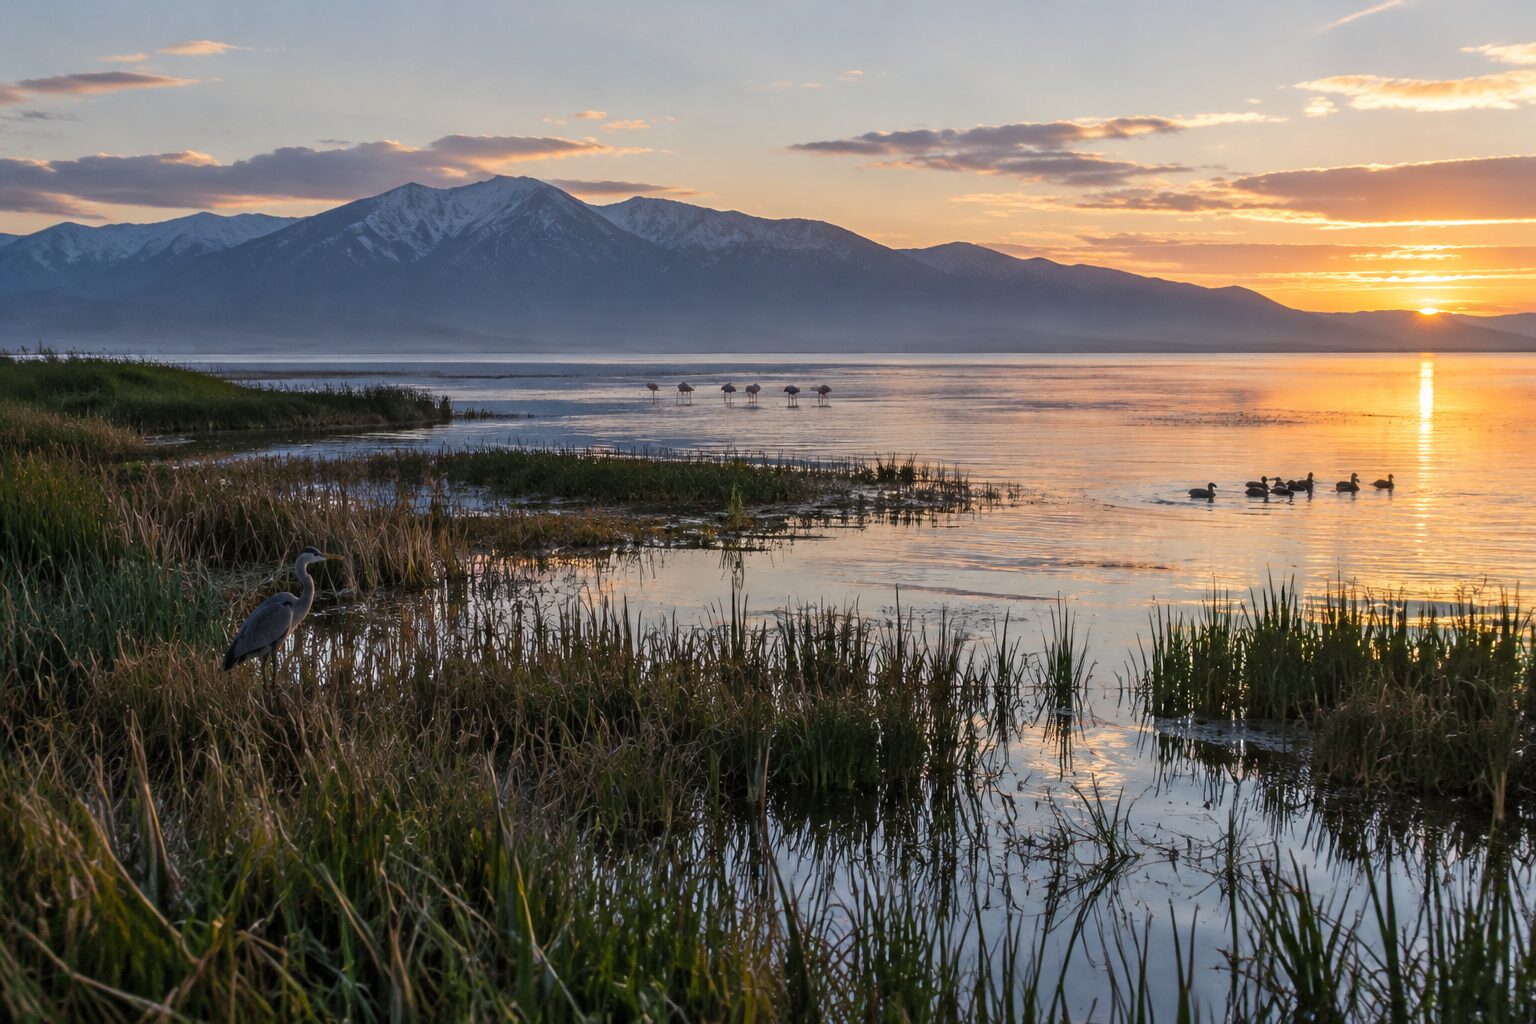
Read more → $60 million Natural Resources Paid in four installments for 22,311 acres added to the Bear River refuge; it must benefit the lake.
Read more → Double in 10 years Operation Gigawatt · KSL The governor's plan aims to double Utah's energy production over a decade.
Read more →
By the Numbers Power, prices, water and air in Utah, this year vs. last
Data stories What the latest numbers say. Updated Nov. 16, 2026; refreshed weekly. Natural gas: 41.2% Coal: 32.2% Solar: 21.3% Hydro: 1.8% Wind: 1.8% Geothermal: 1.3% Other: 0.3% 26.2M MWh, Jan.–Aug Natural gas 41.2% Coal 32.2% Solar 21.3% Hydro 1.8% Wind 1.8% Geothermal 1.3% Other 0.3% Gas prices · weekly Pump prices rose from $2.91 to $3.95 in a year Rocky Mountain states, regular gasoline. The open dot marks the same week a year earlier.
$2.14 $2.82 $3.50 $4.17 $4.85 Jan 2025 Jul Jan 2026 Jul Nov. 10, 2025: $2.91 $2.91 Nov. 9, 2026: $3.95 $3.95 Great Salt Lake · south arm The lake dropped 1.2 feet in a year It rises with spring runoff and falls through summer; the open dot is a year ago.
4,189.1 4,190.3 4,191.6 4,192.8 4,194.0 Jan 2025 Jul Jan 2026 Jul Nov. 15, 2025: 4,191.2 4,191.2 Nov. 15, 2026: 4,190.0 4,190.0 Air quality · Salt Lake County 121 good-air days in 2025, vs. 150 the year before Each bar is one year of days, by EPA air-quality category.
2023 2023, Good: 149 days 149 2023, Moderate: 200 days 200 2023, Unhealthy for sensitive groups: 15 days 2023, Unhealthy: 1 days 2024 2024, Good: 150 days 150 2024, Moderate: 173 days 173 2024, Unhealthy for sensitive groups: 38 days 38 2024, Unhealthy: 4 days 2024, Very unhealthy: 1 days 2025 2025, Good: 121 days 121 2025, Moderate: 228 days 228 2025, Unhealthy for sensitive groups: 15 days 2025, Unhealthy: 1 days
This year vs. last year Every measure in charts, with its source How much each measure changed from a year earlier Percent change. Dark bars went up, light bars went down; neither color means good or bad.
-88% -44% +44% +88% 0 ◀ Down Up ▶ Utility jobs Utility jobs: +4.1% +4.1% Mining and logging jobs Mining and logging jobs: -0.9% -0.9% Home electricity price Home electricity price: -2.3% -2.3% Home natural gas price Home natural gas price: +5.9% +5.9% Gas at the pump Gas at the pump: +35.6% +35.6% Crude oil produced Crude oil produced: +2.1% +2.1% Electricity generated Electricity generated: +3.2% +3.2% Power from coal Power from coal: -31.1% -31.1% Power from natural gas Power from natural gas: +51.7% +51.7% Power from solar Power from solar: +20.8% +20.8% Reservoir storage Reservoir storage: -21.7% -21.7% Unhealthy air days Unhealthy air days: -62.8% -62.8%
This year and last year, side by side Utility jobs Sept. 2026 vs. 2025
▲ +4.1% Before 4,900
Now 5,100
BLS, via FRED Mining and logging jobs Sept. 2026 vs. 2025
▼ -0.9% Before 11,100
Now 11,000
BLS, via FRED Home electricity price Cents per kWh, Aug. 2026 vs. 2025
▼ -2.3% Before 13.62¢
Now 13.31¢
EIA Home natural gas price Per 1,000 cubic feet, Aug. 2026 vs. 2025
▲ +5.9% Before $12.07
Now $12.78
EIA Gas at the pump Rocky Mountain regular, week of Nov. 9, 2026 vs. a year earlier
▲ +35.6% Before $2.91
Now $3.95
EIA, via FRED Crude oil produced Thousand barrels, Jan. to Aug. 2026 vs. 2025
▲ +2.1% Before 45,826
Now 46,777
EIA Electricity generated Thousand MWh, Jan. to Aug. 2026 vs. 2025
▲ +3.2% Before 25,385
Now 26,194
EIA Power from coal Thousand MWh, Jan. to Aug. 2026 vs. 2025
▼ -31.1% Before 12,251
Now 8,447
EIA Power from natural gas Thousand MWh, Jan. to Aug. 2026 vs. 2025
▲ +51.7% Before 7,113
Now 10,789
EIA Power from solar Thousand MWh, Jan. to Aug. 2026 vs. 2025
▲ +20.8% Before 4,617
Now 5,576
EIA Reservoir storage Statewide, end vs. start of the water year
▼ -21.7% Start 60% full
End 47% full
KSL Unhealthy air days Salt Lake County, 2025 vs. 2024 (AQI above 100)
▼ -62.8% Before 43 days
Now 16 days
EPA AirData How to read it. Utah is making more power than a year ago, with natural gas and solar replacing coal. Home electricity cost less than a year earlier, while home natural gas and pump prices rose. The Great Salt Lake and the state's reservoirs are lower after a dry year, and Salt Lake County had fewer unhealthy air days.
Show as a table Measure Latest Year earlier Change Source How often Utility jobs Sept. 2026 vs. 2025 5,100 4,900 ▲ +4.1% BLS, via FRED Monthly Mining and logging jobs Sept. 2026 vs. 2025 11,000 11,100 ▼ -0.9% BLS, via FRED Monthly Home electricity price Cents per kWh, Aug. 2026 vs. 2025 13.31¢ 13.62¢ ▼ -2.3% EIA Monthly Home natural gas price Per 1,000 cubic feet, Aug. 2026 vs. 2025 $12.78 $12.07 ▲ +5.9% EIA Monthly Gas at the pump Rocky Mountain regular, week of Nov. 9, 2026 vs. a year earlier $3.95 $2.91 ▲ +35.6% EIA, via FRED Weekly Crude oil produced Thousand barrels, Jan. to Aug. 2026 vs. 2025 46,777 45,826 ▲ +2.1% EIA Monthly Electricity generated Thousand MWh, Jan. to Aug. 2026 vs. 2025 26,194 25,385 ▲ +3.2% EIA Monthly Power from coal Thousand MWh, Jan. to Aug. 2026 vs. 2025 8,447 12,251 ▼ -31.1% EIA Monthly Power from natural gas Thousand MWh, Jan. to Aug. 2026 vs. 2025 10,789 7,113 ▲ +51.7% EIA Monthly Power from solar Thousand MWh, Jan. to Aug. 2026 vs. 2025 5,576 4,617 ▲ +20.8% EIA Monthly Reservoir storage Statewide, end vs. start of the water year 47% full 60% full ▼ -21.7% KSL Yearly Unhealthy air days Salt Lake County, 2025 vs. 2024 (AQI above 100) 16 days 43 days ▼ -62.8% EPA AirData Yearly
About these numbers Pump prices are for the Rocky Mountain states (Utah, Colorado, Idaho, Montana and Wyoming); EIA doesn't publish a Utah-only weekly price. Electricity generation counts utility-scale plants only; rooftop solar isn't included. “Other” is biomass, petroleum and other fuels. Lake level is the south arm at Saltair (USGS gauge 10010000); the north arm runs lower. Unhealthy air days are days the county's highest monitor topped AQI 100. Jobs and prices are revised by their agencies.
STEP 1 · WHAT MATTERS TO YOU? Air and permits Water rights Utilities and bills Oil, gas and energy Spills and cleanup
STEP 2 · WHICH GOVERNMENT? Utah On your own Federal County City All
STEP 3
More actions →
State offices for energy, water and environment 7 offices that permit, regulate or help All industries → Spills and emergencies Environmental Quality 24-hour line, (801) 536-4123
Water rights Division of Water Rights, (801) 538-7240
Utility complaints Division of Public Utilities, (801) 530-7622