Skip to content
Utah Business AIWhere Utah business connects.

Business · Restaurants & food

Restaurants & Food

The state rules for Utah restaurants, bars, food trucks, caterers and home food businesses, for two audiences: diners, and the owners, cooks, servers and bartenders who run them. Each step links to the office that handles it. Restaurant inspections are done by your local health department. Farms are on the Agriculture page.

Diners Owners and workers By the numbers Check a restaurant Eat out safely Open a food business Alcohol licenses Serve alcohol responsibly Restaurant workers State offices All industries
A bakery owner and a loan officer go over paperwork at a cafe table
Restaurant liquor quota1 per 4,467Full-service restaurant licenses per resident (2023 law).
Tipped minimum wage$2.13An hour, if tips bring pay to $7.25.
Federal tip deduction$25,000A year, for 2025 through 2028.

Source: Utah Legislature; Utah Labor Commission; IRS.

About

Who oversees restaurants
LegislativeExecutiveJudicial
  • Alcoholic Beverage ServicesLicenses restaurants and bars to serve alcohol. Source
  • Local health departmentsInspect restaurants and issue food truck permits. Source
  • Agriculture and FoodRegulates cottage food, food makers and grocery stores. Source

Why it matters

Numbers worth knowing
  • ClosuresOwners blamed higher wages and food prices, flat sales and less downtown foot traffic. Source
  • InspectionsSalt Lake County inspects every restaurant at least once a year and averages about one closure a week. Source
  • ID checksSince Jan. 1, 2026, every alcohol customer must show ID. Source
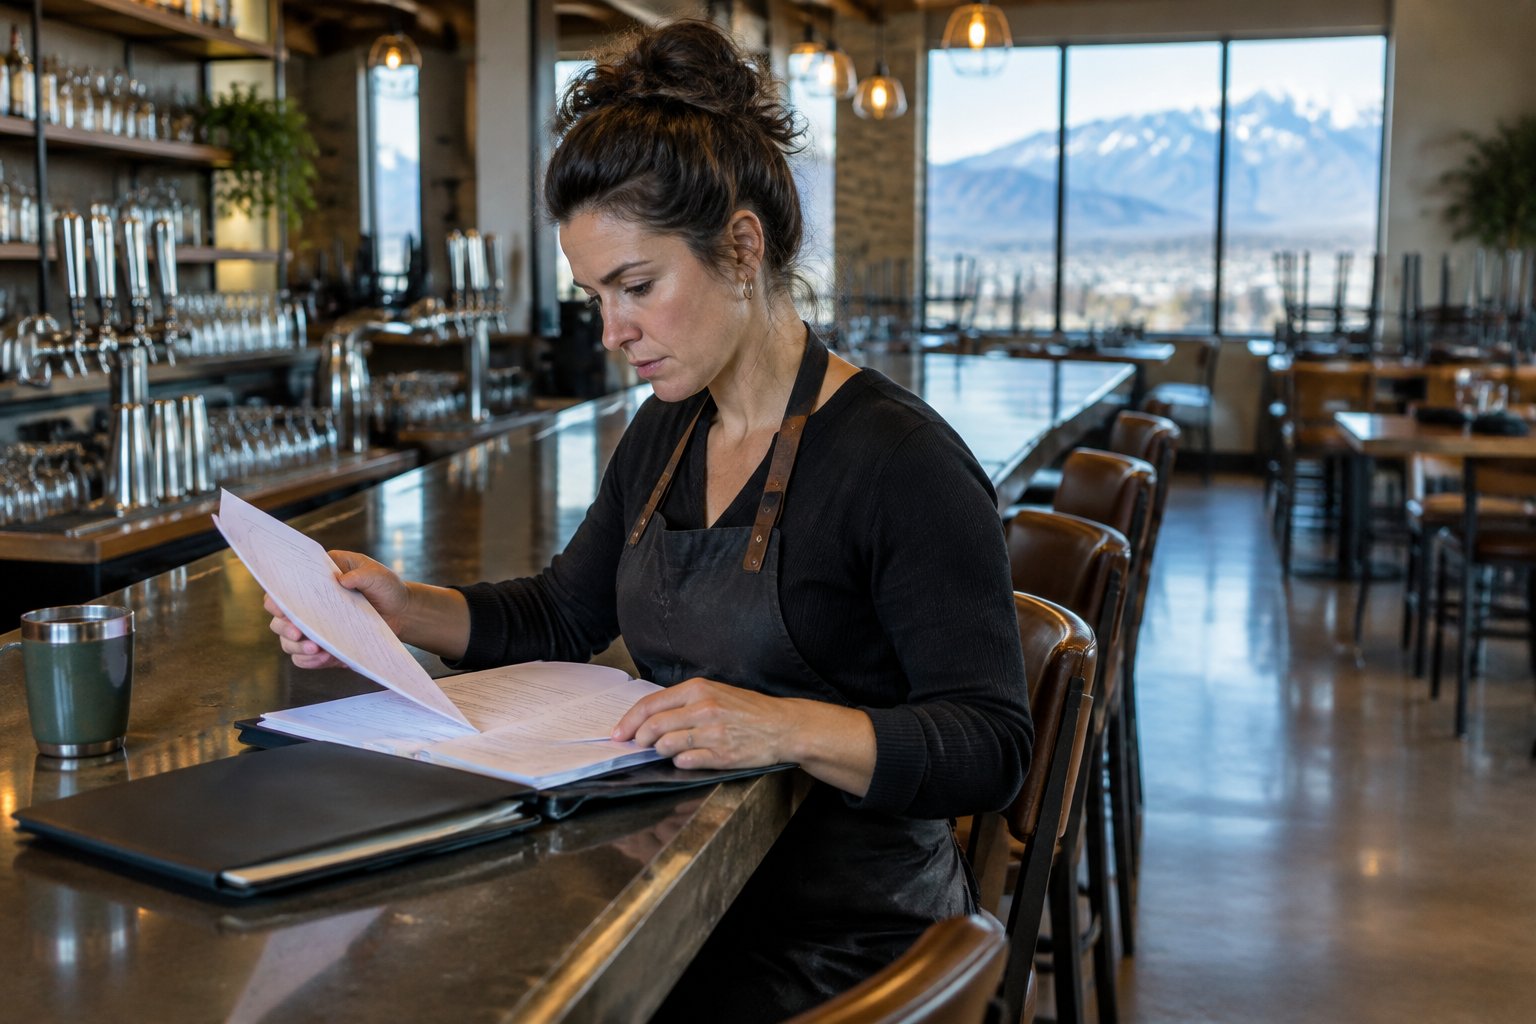
A restaurant owner reviews paperwork at a bar counter

Eating out and running a kitchen

Food permits, liquor licenses and tips

  1. UtahFree
    Ask which food permit you need Not sure which state food program covers your business? Ask the Agriculture Department with its online form, or call 801-982-2200. Go to the source →
  2. UtahQuota
    Know the license quota Licenses are capped by population: one full-service restaurant license per 4,467 residents and one bar license per 10,200 (2023 law). Go to the source →
  3. UtahRequired
    Check every customer's ID Since Jan. 1, 2026, all alcohol licensees must check ID for every alcohol customer, whatever their apparent age. Go to the source →

Restaurants calendar

November 2026
SMTWTFS123456789101112131415161718192021222324252627282930
Nov. 19
Liquor commission meetsThe Alcoholic Beverage Services Commission votes on new liquor licenses. Alcoholic Beverage Services
Jan. 19
Legislature opensThe 2027 session runs to March 5; alcohol and food bills are heard there. Utah Legislature
Jan. 31
Beer-only licenses renewBeer-only alcohol licenses must be renewed by Jan. 31. Alcoholic Beverage Services
More events →

Diners

Eating out safely, checking inspections and food help

News for diners

Closings, openings, food safety and food help
A woman opens the door of a shop on a downtown street
Restaurants · Salt Lake Tribune · Aug. 15Why are so many Utah restaurants closing?Owners point to higher wages and food prices and sales that stopped growing; downtown spots also cite fewer office workers, construction and parking changes.

What the state data shows

Openings minus closings, Q1 2025 to Q1 2026: +184 restaurants and bars statewide (6,401 to 6,585). Some types lost; most gained.

Limited-serviceLimited-service: +118+118Full-serviceFull-service: +29+29Coffee shops and snack barsCoffee shops and snack bars: +19+19BarsBars: -1-1Food trucks and cartsFood trucks and carts: +6+6Food service contractorsFood service contractors: +11+11CaterersCaterers: +5+5Cafeterias and buffetsCafeterias and buffets: -3-3
Locations with paid employees. Source: BLS. The closings in the story are real; this shows the statewide balance.
What you can do: Eat out safely
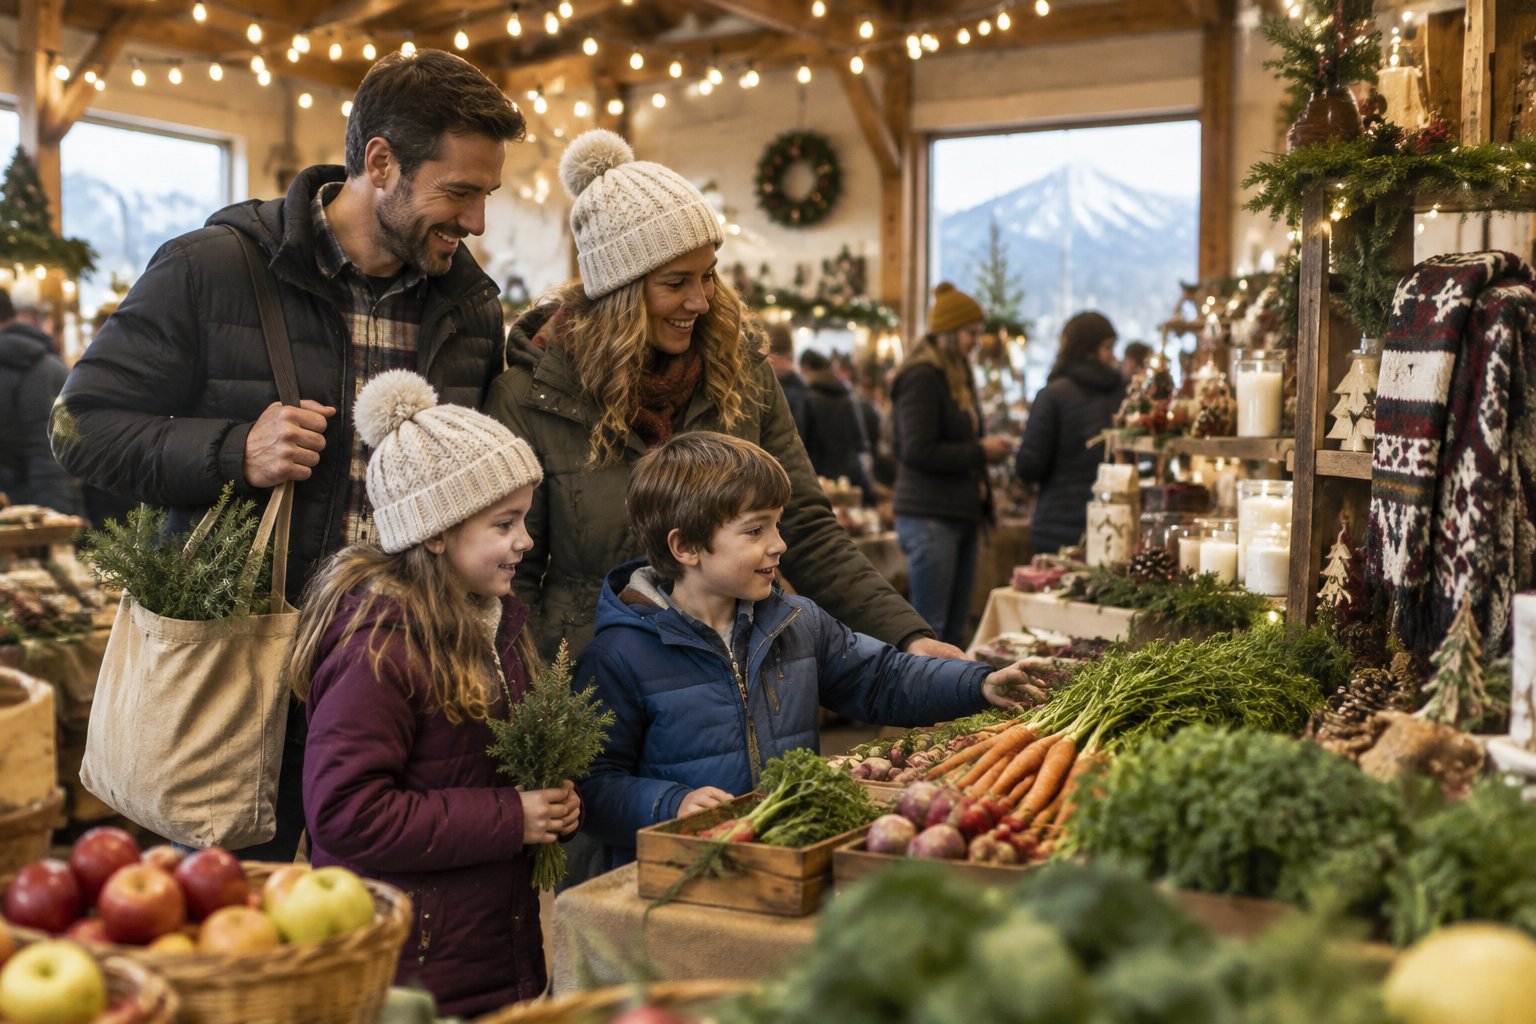
A family in winter coats shops at a holiday market
Openings · Salt Lake Tribune · Oct. 24New openings and closings on Utah's food sceneThe Tribune's weekly roundup of restaurant news.Eat out safely →

Restaurants and bars in Utah

6,585 restaurants and bars with employees, +184 in a year.

Q1 2024: 6,147Q2 2024: 6,272Q3 2024: 6,365Q4 2024: 6,421Q1 2025: 6,401Q2 2025: 6,430Q3 2025: 6,523Q4 2025: 6,586Q1 2026: 6,5856,147Q1 20246,585Q1 2026

Source: BLS, quarterly

More Utah news →

At a glance

A mother holding her baby talks with a clinic receptionist

Sick from food?

Report it

Utah Health and Human ServicesReport a suspected foodborne illness online so the state can spot outbreaks.

Read more →
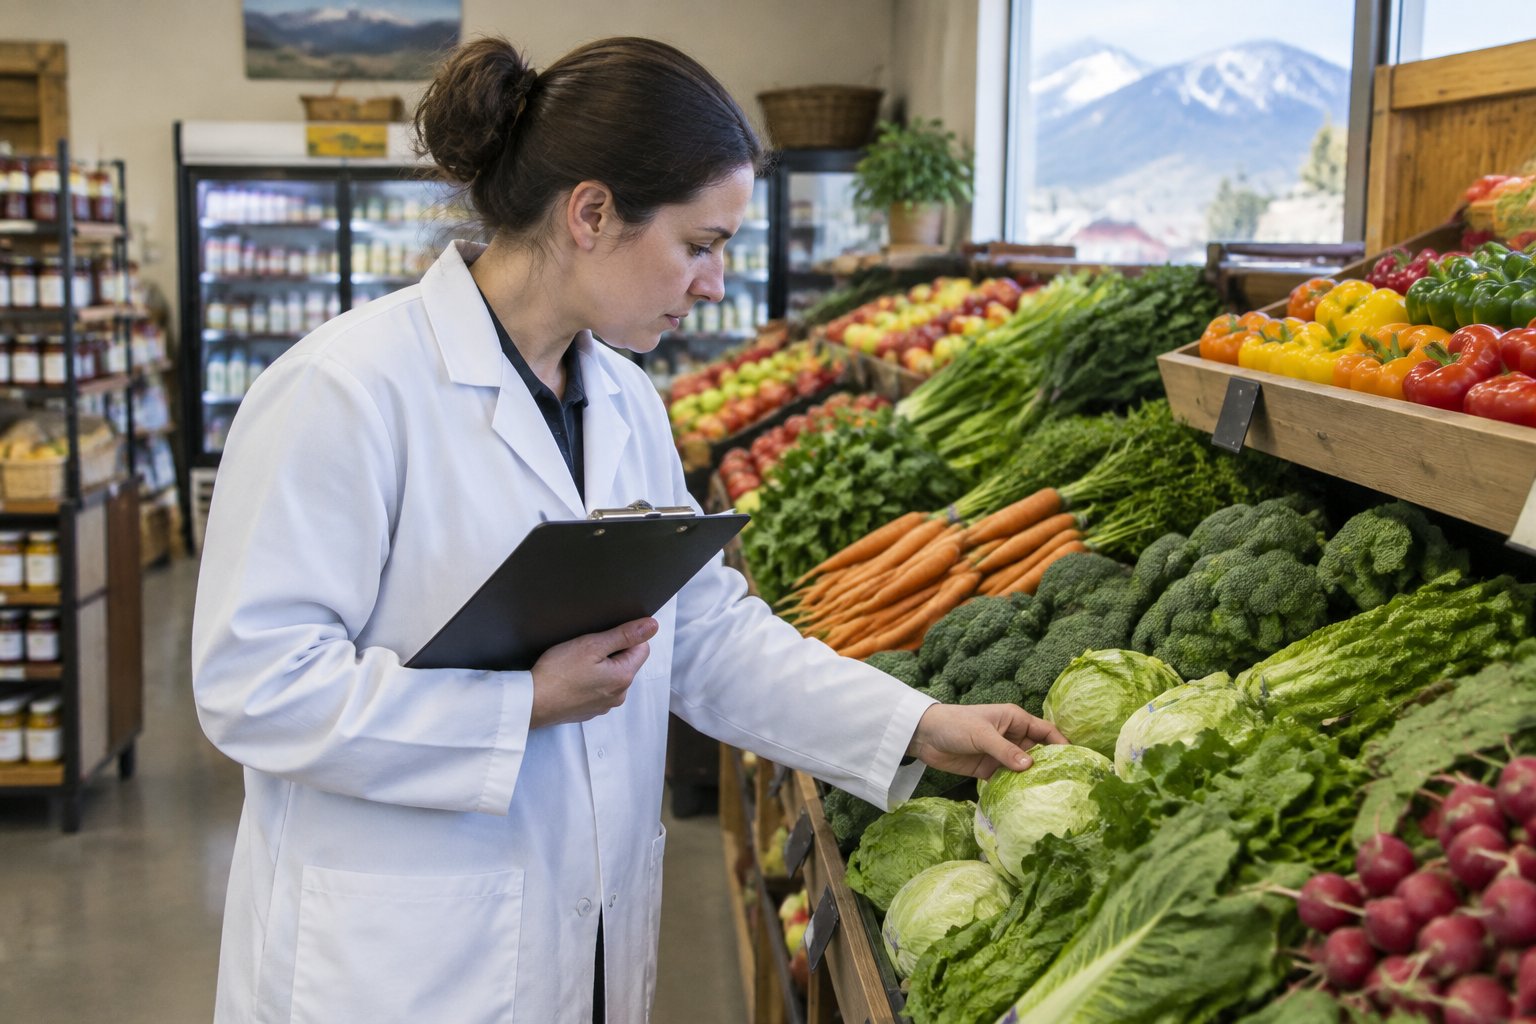
An inspector with a clipboard checks produce in a grocery store

Salt Lake County

Look it up

Salt Lake County HealthFree inspection reports for every permitted restaurant, updated each weekday, plus current closures.

Read more →
A woman on the phone reads a letter at her laptop

Davis County

Look it up

Davis County HealthSearch inspection results by restaurant name, address or permit number.

Read more →
A family explores a cultural festival in a city park

Food trucks

Check the permit

Salt Lake County Health, via KSL NewsRadioLook for a current health permit on the truck, cart or booth before you buy.

Read more →
A shopper checks a grocery receipt

Recalls

One list

FoodSafety.govCurrent USDA and FDA food recalls and alerts in one place.

Read more →
Two people talk at a table

SNAP at restaurants

Not in Utah

USDA, via NewsweekNine states let older, disabled or homeless SNAP users buy restaurant meals; Utah doesn't take part.

Read more →
A business owner hangs a framed license on the wall

Ordering a drink

Show ID

Alcoholic Beverage ServicesSince Jan. 1, 2026, every alcohol customer must show ID, whatever their age.

Read more →
A shopper picks out jars of jam at a local food shop

One inspection

A snapshot

Salt Lake County Health, via KSLOne report is one moment; look at several before you judge a restaurant.

Read more →

Restaurant Owners and Workers

Licenses, permits, wages and tips for owners, cooks, servers and bartenders

News for owners and workers

Liquor licenses, tips and expansions
People speak at a public meeting
Liquor licenses · Gastronomic SLC · Oct. 29No new bar license applicants at October's liquor commission meetingWith 47 bar licenses available statewide and more coming in summer 2027, bar licenses are no longer scarce; 11 restaurants won full liquor licenses.

Bar licenses available statewide

Open licenses under the population quota after each meeting. The quota grew in July 2024 and keeps rising with population.

Aug. 2023: 9 (Salt Lake Tribune)9Aug. 2023Nov. 2024: 4 (Salt Lake Tribune)4Nov. 2024April 2026: 25 (Salt Lake Tribune)25April 2026Sept. 2026: 45 (Gastronomic SLC)45Sept. 2026Oct. 2026: 47 (Gastronomic SLC)47Oct. 2026
Counts announced at commission meetings, as reported by Salt Lake Tribune (Aug. 2023), Salt Lake Tribune (Nov. 2024), Salt Lake Tribune (April 2026), Gastronomic SLC (Sept. 2026), Gastronomic SLC (Oct. 2026).
What you can do: Alcohol licenses
Two shop owners smile in the doorway of their store on a mountain-town main street
Expansion · KSL · Aug. 28Burger chain plans six more Utah locationsA franchise group signed on for six new restaurants.Open a food business →

Counter-service restaurants in Utah

3,091 counter-service restaurants with employees, +118 in a year.

Q1 2024: 2,866Q2 2024: 2,894Q3 2024: 2,930Q4 2024: 2,958Q1 2025: 2,973Q2 2025: 3,005Q3 2025: 3,043Q4 2025: 3,056Q1 2026: 3,0912,866Q1 20243,091Q1 2026

Source: BLS, quarterly

A woman works on a laptop in a bright room
Openings · Deseret News · Sept. 12A national restaurant chain opens in downtown Salt Lake CityIt opened Sept. 2 in the historic Pickle Building.Alcohol licenses →

Full-service restaurants in Utah

1,850 full-service restaurants with employees, +29 in a year.

Q1 2024: 1,746Q2 2024: 1,785Q3 2024: 1,803Q4 2024: 1,830Q1 2025: 1,821Q2 2025: 1,818Q3 2025: 1,836Q4 2025: 1,859Q1 2026: 1,8501,746Q1 20241,850Q1 2026

Source: BLS, quarterly

More business news →

At a glance

A person reads state rules on a laptop at a library table

Bar licenses open

47

Gastronomic SLC, Oct. 29Statewide after the October commission meeting, which had no new bar applicants.

Read more →
A man reviews documents at a desk

Apply by

The 10th

Alcoholic Beverage ServicesApplications in by the 10th go to that month's commission meeting.

Read more →
A worker looks over his pay stub

Tipped wage

$2.13

Labor CommissionAn hour, if tips bring pay to the $7.25 minimum wage.

Read more →
A young family goes over paperwork at home

Tip deduction

$25,000

IRS Tax Tip 2026-06Qualified tips you can deduct from federal taxable income each year through 2028.

Read more →
A worker reviews paperwork at a desk

Food handlers

3 years

Utah rule R392-103Get a food handler permit within 30 days of starting; it's good statewide.

Read more →
An instructor trains a worker on a machine

Server training

Every 3 years

Alcoholic Beverage ServicesRequired before serving; managers finish manager training within 30 days of hire.

Read more →
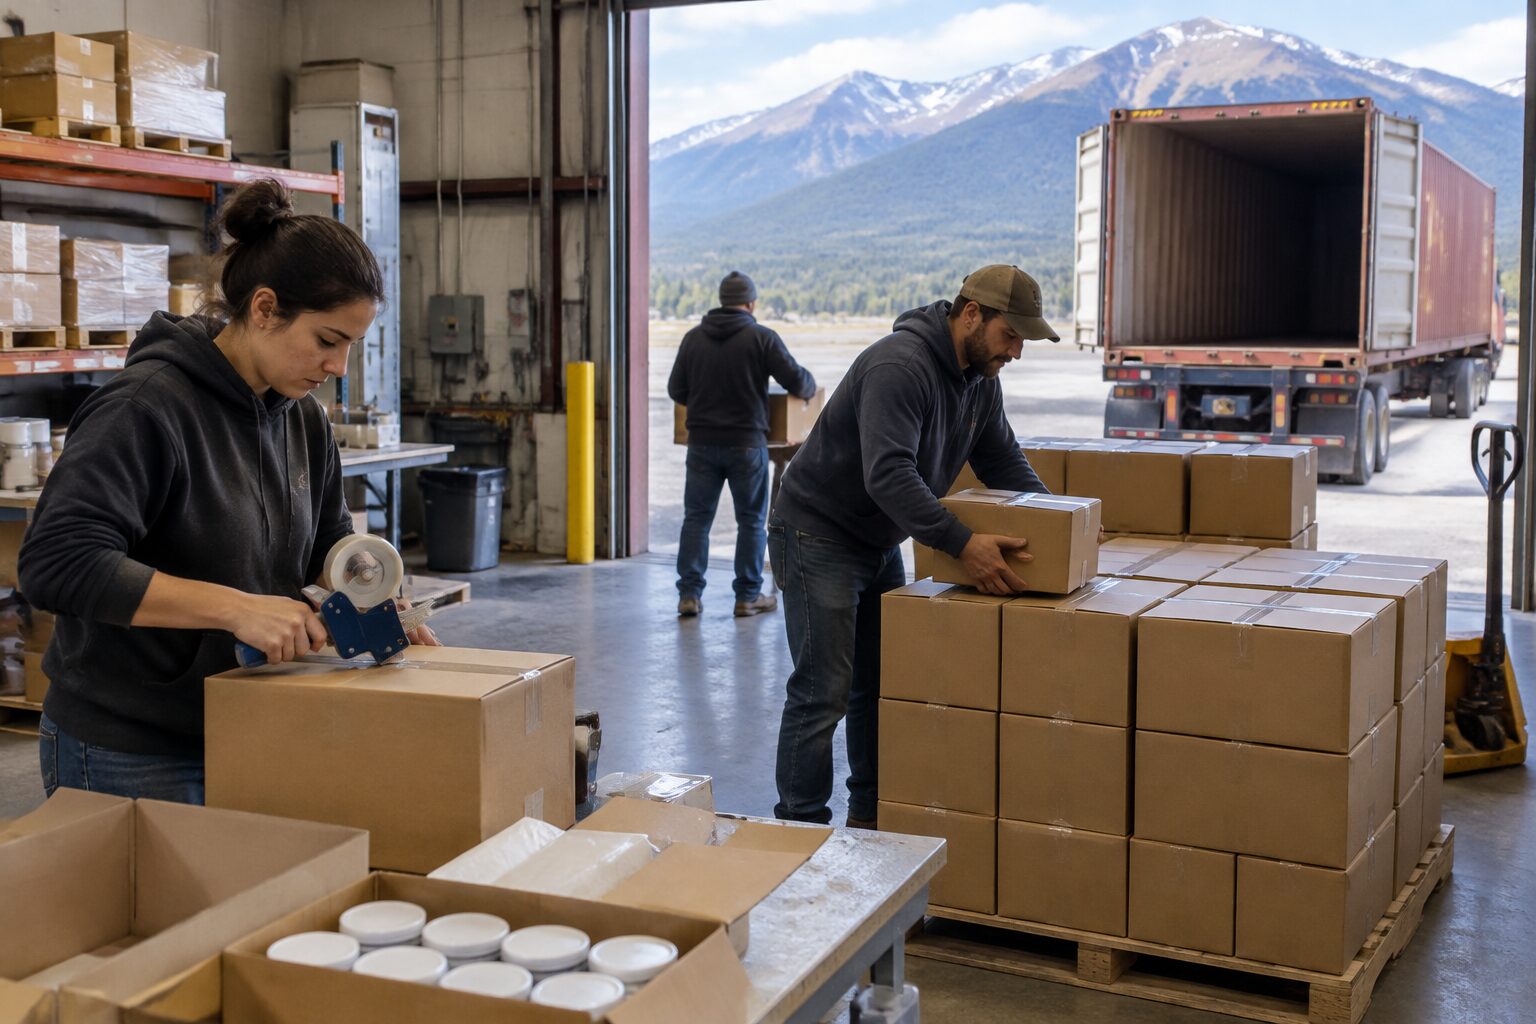
Workers load boxes onto a truck at a warehouse dock

Food trucks

One permit

Utah rule R392-102-4A yearly permit from your main county health department is honored statewide.

Read more →
A rancher works on a laptop at a farmhouse table

Utah County

New rule

Utah County Health Regulation 26-01Since July 27, 2026, repeat priority violations can bring warning letters, fines and re-inspection fees.

Read more →

By the Numbers

Jobs, sales, openings, prices and family meal costs for Utah restaurants

Data stories

What the latest numbers say. Updated Nov. 16, 2026; refreshed weekly.
Limited-service (counter, fast food): 3,091 (46.9%)Full-service (table service): 1,850 (28.1%)Coffee shops and snack bars: 896 (13.6%)Bars: 219 (3.3%)Food trucks and carts: 211 (3.2%)Food service contractors: 165 (2.5%)Caterers: 122 (1.9%)Cafeterias and buffets: 31 (0.5%)6,585locations
  • Limited-service (counter, fast food)3,09146.9%
  • Full-service (table service)1,85028.1%
  • Coffee shops and snack bars89613.6%
  • Bars2193.3%
  • Food trucks and carts2113.2%
  • Food service contractors1652.5%
  • Caterers1221.9%
  • Cafeterias and buffets310.5%
Openings vs. closings · BLS · Q1 2026Utah added 184 restaurants and bars in a year6,585 restaurants and bars had employees in the first quarter of 2026. Limited-service places changed most (+118), and they now make up 47% of the total. Only bars and cafeterias/buffets each had more closings than openings.See it by type: Openings vs. closings
Jobs · 2026 vs. 2025

Restaurant jobs topped last year in 6 of 9 months

Jobs climb every spring and summer and dip in fall; the gap between the lines is the yearly change.

Restaurant and bar jobs in Utah
114K117K120K124K127KJan 2025: 116.7 thousand jobsFeb 2025: 118.0 thousand jobsMar 2025: 119.4 thousand jobsApr 2025: 121.3 thousand jobsMay 2025: 122.2 thousand jobsJun 2025: 122.9 thousand jobsJul 2025: 122.0 thousand jobsAug 2025: 123.0 thousand jobsSep 2025: 121.4 thousand jobsJan 2026: 116.7 thousand jobsFeb 2026: 118.9 thousand jobsMar 2026: 118.9 thousand jobsApr 2026: 120.6 thousand jobsMay 2026: 122.9 thousand jobsJun 2026: 123.9 thousand jobsJul 2026: 124.4 thousand jobsAug 2026: 125.4 thousand jobsSep 2026: 123.0 thousand jobsJanFebMarAprMayJunJulAugSep

2025 2026 · Thousands of jobs, not seasonally adjusted.

Restaurant tax · 2026 vs. 2025

Collections beat last year in 8 of 10 months

Up to 1% of restaurant sales in counties that charge it. Single months swing with filing schedules.

Restaurant tax collected each month
$0.0M$2.5M$5.0M$7.5M$10.0MJan 2025: $5,600,457Jan 2026: $8,198,101JanFeb 2025: $8,209,750Feb 2026: $8,358,267FebMar 2025: $7,285,192Mar 2026: $6,746,918MarApr 2025: $7,083,958Apr 2026: $7,477,396AprMay 2025: $9,735,137May 2026: $9,848,492MayJun 2025: $6,674,333Jun 2026: $7,728,106JunJul 2025: $7,600,202Jul 2026: $7,642,705JulAug 2025: $9,185,002Aug 2026: $9,499,408AugSep 2025: $7,726,481Sep 2026: $8,482,415SepOct 2025: $8,204,200Oct 2026: $7,538,824Oct

2025 2026 · Single months swing with filing schedules; compare 12-month totals.

Locations · each quarter

Restaurant count up 184 in a year, to 6,585

Locations with paid employees. Counts arrive about six months after each quarter.

Restaurant and bar locations, each quarter
5,7506,0006,2506,5006,750First quarter of 2024: 6,147 locationsQ12024Second quarter of 2024: 6,272 locationsQ2Third quarter of 2024: 6,365 locationsQ3Fourth quarter of 2024: 6,421 locationsQ4First quarter of 2025: 6,401 locationsQ12025Second quarter of 2025: 6,430 locationsQ2Third quarter of 2025: 6,523 locationsQ3Fourth quarter of 2025: 6,586 locationsQ4First quarter of 2026: 6,585 locationsQ12026

The scale starts at 5,750, not zero, so the small changes are visible.

This year vs. last year

Every measure in charts, with its source
How much each measure changed from a year earlier

Percent change. Dark bars went up, light bars went down; neither color means good or bad.

-6%-3%+3%+6%0◀ DownUp ▶Restaurant and bar jobsRestaurant and bar jobs: +1.3%+1.3%Restaurants and barsRestaurants and bars: +2.9%+2.9%Restaurant tax, 12 monthsRestaurant tax, 12 months: +3.7%+3.7%Restaurant tax, year to dateRestaurant tax, year to date: +5.5%+5.5%Restaurant prices, Western cities like Utah'sRestaurant prices, Western cities like Utah's: +2.9%+2.9%Restaurant prices, all Western statesRestaurant prices, all Western states: +3.3%+3.3%Household spending on eating outHousehold spending on eating out: -3.1%-3.1%Restaurant output after inflationRestaurant output after inflation: -1.3%-1.3%

This year and last year, side by side

Restaurant and bar jobsSept. 2026 vs. 2025
▲ +1.3%
2025121,400
2026123,000
BLS
Restaurants and barsQ1 2026 vs. 2025
▲ +2.9%
20256,401
20266,585
BLS
Restaurant tax, 12 monthsTo Oct. 2026 vs. a year earlier
▲ +3.7%
2025$93.8M
2026$97.2M
Tax Commission
Restaurant tax, year to dateJan. to Oct. 2026 vs. 2025
▲ +5.5%
2025$77.3M
2026$81.5M
Tax Commission
Restaurant prices, Western cities like Utah'sSept. 2026 vs. 2025 (price index)
▲ +2.9%
2025246.2
2026253.4
BLS
Restaurant prices, all Western statesSept. 2026 vs. 2025 (price index)
▲ +3.3%
BLS reports the 12-month change only.
0%+6%
BLS
Household spending on eating outWestern households, 2024 vs. 2023
▼ -3.1%
2023$4,782
2024$4,634
BLS
Restaurant output after inflationUtah, 2025 vs. 2024
▼ -1.3%
2024$3.65B
2025$3.61B
BEA
How to read it. Utah restaurants employ more people than a year ago, and restaurant tax collections are up. Menu prices in the West rose almost as fast, so most of that rise is higher prices, not more meals. After inflation, the industry's output slipped in 2025.
Show as a table
Year-over-year change for Utah's restaurants and bars (NAICS 722). Arrows show direction only, not good or bad.
MeasureLatestYear earlierChangeSourceHow often
Restaurant and bar jobsSept. 2026 vs. Sept. 2025123,000121,400▲ +1.3%BLS, via FREDMonthly
Restaurant tax collected12 months to Oct. 2026 vs. a year earlier$97.2M$93.8M▲ +3.7%Utah State Tax CommissionMonthly
Restaurant tax, year to dateJan. to Oct. 2026 vs. Jan. to Oct. 2025$81.5M$77.3M▲ +5.5%Utah State Tax CommissionMonthly
Restaurant menu pricesWestern states, Sept. 2026 vs. Sept. 2025Index 408.6—▲ +3.3%BLS price indexMonthly
Restaurant prices in Western cities like Utah'sMetro areas under 2.5 million, Sept. 2026 vs. Sept. 2025Index 253.4Index 246.2▲ +2.9%BLS price index, via FREDMonthly
Household spending on eating outWestern households, 2024 vs. 2023$4,634$4,782▼ -3.1%BLS spending survey, via FREDYearly
Restaurant output after inflationUtah, 2025 vs. 2024$3.61B$3.65B▼ -1.3%BEA real GDP, via FREDYearly
About these numbers
  • The restaurant tax is up to 1% of restaurant sales in counties that charge it, so collections follow sales. A 2025 law also taxed prepared food at gas stations, convenience stores and grocery stores, so part of the rise may come from that, not restaurants.
  • Collections are what the Tax Commission paid counties each month, before its small deduction. Monthly figures swing with filing schedules.
  • Menu prices are for 13 Western states; BLS doesn't publish a Utah-only figure.
  • Jobs are a monthly estimate and get revised. For restaurant counts and pay by county, see the quarterly BLS employment and wages census.

Restaurant counts come from the BLS Quarterly Census of Employment and Wages; BLS doesn't publish separate opening and closing counts for Utah restaurants, so “added” means openings minus closings. Family meal prices are national chain averages from Revenue Management Solutions, times four.

Every chart and source →

Check a restaurant before you eat

Inspection reports by county
  • Salt Lake CountyReports for every permitted restaurant, updated each weekday, plus closures
  • Davis CountySearch by restaurant name, address or permit number
  • Utah CountyInspections have been searchable online since 2011; find the search on the health department site
  • Other countiesInspections are done by your local health department; ask it for reports

One inspection is a snapshot of one visit, so read a few. Owners: the same reports show how your kitchen compares.

Take action

STEP 1 · WHAT MATTERS TO YOU?
STEP 2 · WHICH GOVERNMENT?
STEP 3

State offices for restaurants and food

4 offices that license, inspect or protect

Alcohol

Food safety

Workers and taxes

All industries →

Who to contact

Food that made you sickReport online at igotsick.health.utah.gov
A restaurant's inspection reportsYour county health department
Which food permit you needAgriculture and Food, (801) 982-2200
Alcohol violationsAlcoholic Beverage Services, (801) 965-4747, ext. 3
Unpaid wagesLabor Commission wage claims